Data · 01 / 04 · dbt · Airflow · Power BI
E-Commerce Analytics Warehouse
100,000 real orders replayed as a live source into a dbt star schema that is tested and reconciled to the cent on every run.
- MySQL 8.4
- Python
- PostgreSQL 16
- dbt
- Airflow
- Power BI
- Excel
- Metabase
- Docker
Why I built this
Every e-commerce company runs on dashboards fed by a warehouse loaded from the live database. Late updates, crashed loads and customers who change address make those numbers quietly disagree with reality, and business decisions get made on them anyway.
Can a dashboard number be trusted to the cent, even when orders arrive late, loads crash halfway and customers move house? I wanted to build the whole path from a live database to a chart, and stop any run whose numbers don't add up.
What I built
The Olist dataset is a static snapshot, so I built a simulator that replays its own timeline into MySQL: orders arrive, get approved, ship and get delivered, and reviews come in later.
A Python loader moves changes into PostgreSQL incrementally, dbt models them into a star schema, Airflow runs it every ten minutes, and every run is tested and reconciled against the source before anyone reads a number.
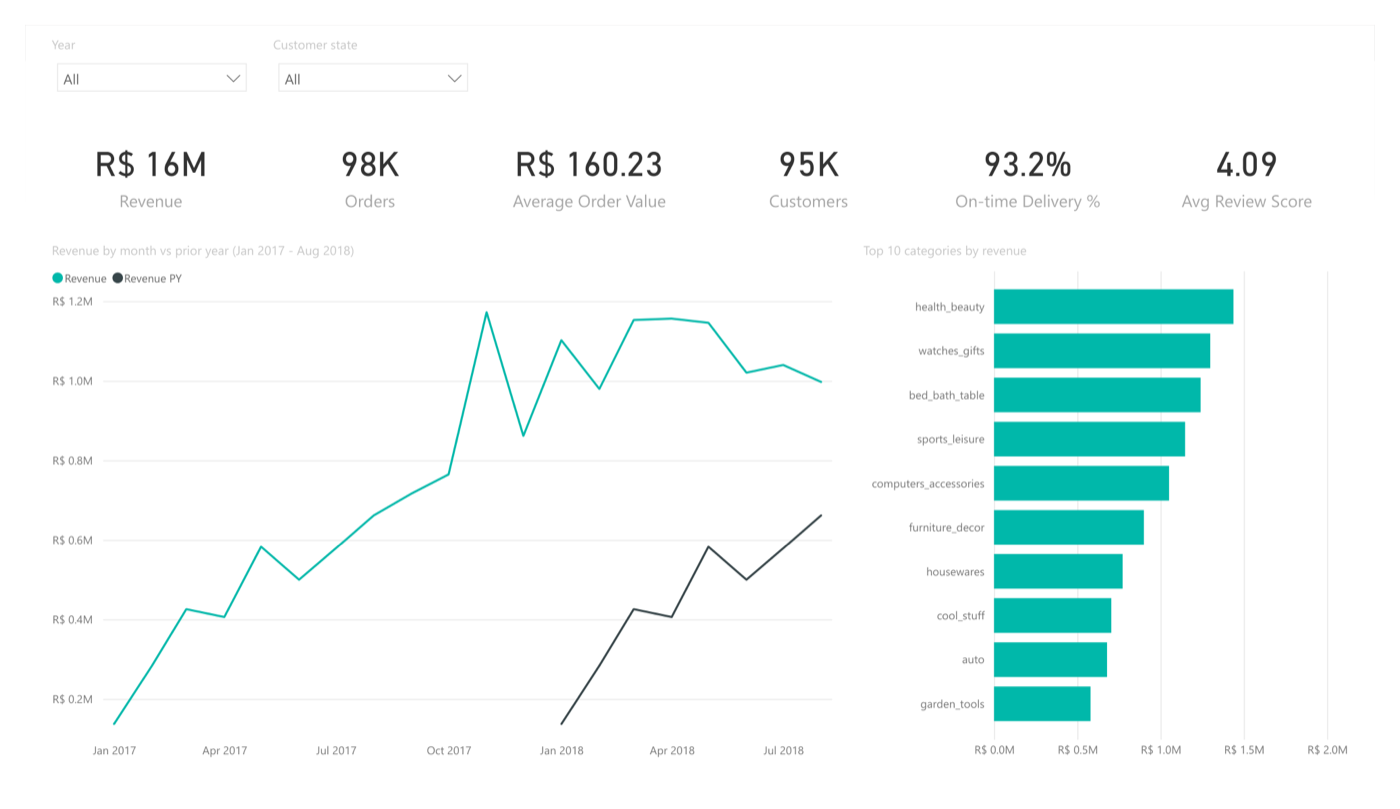
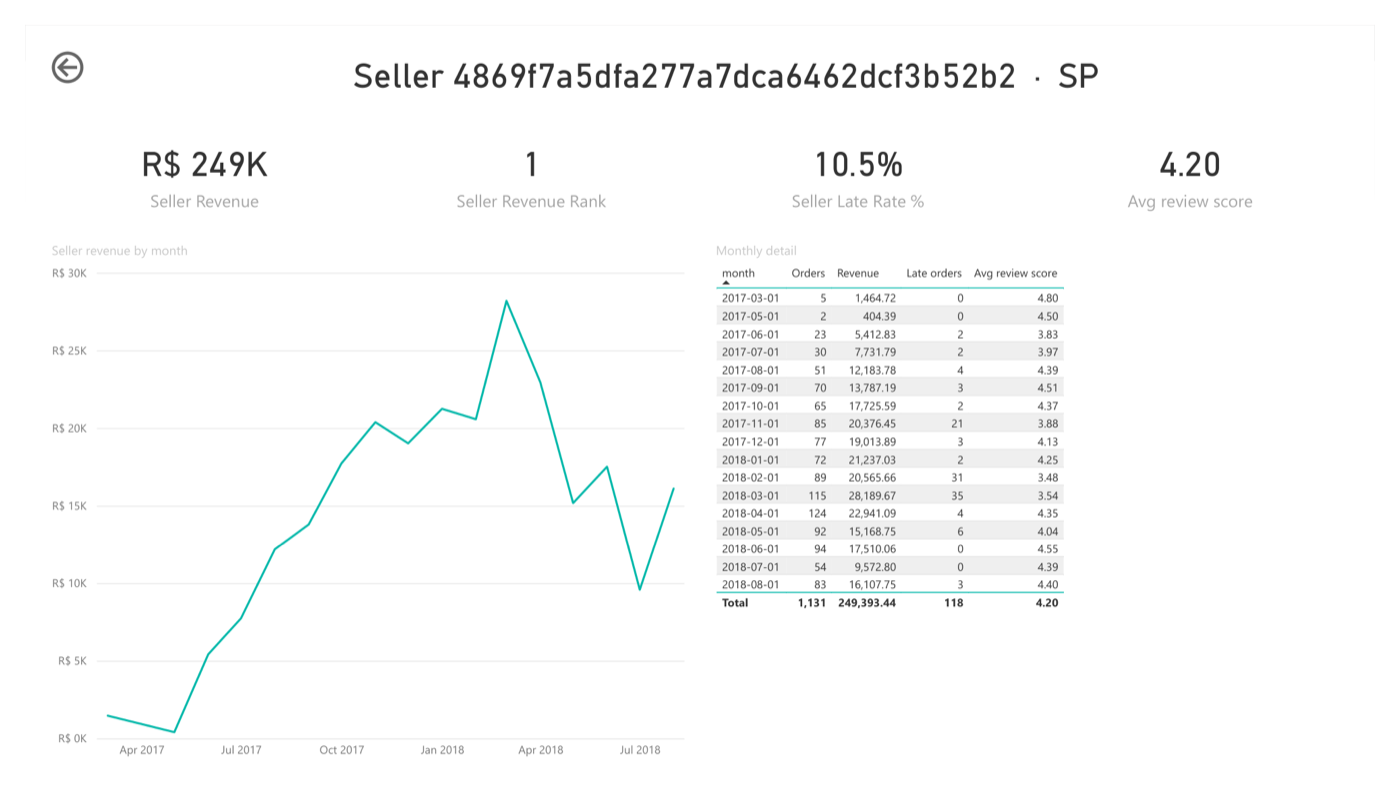
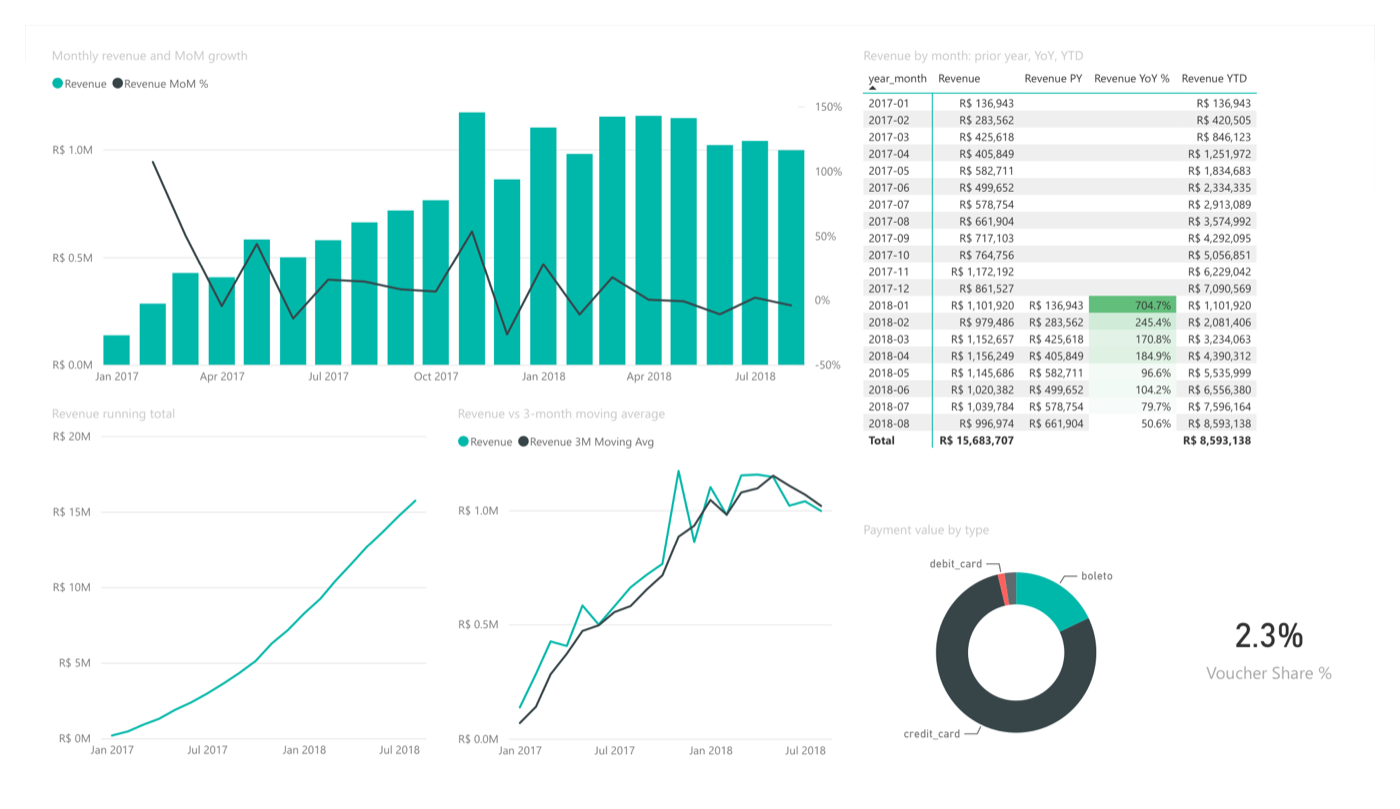
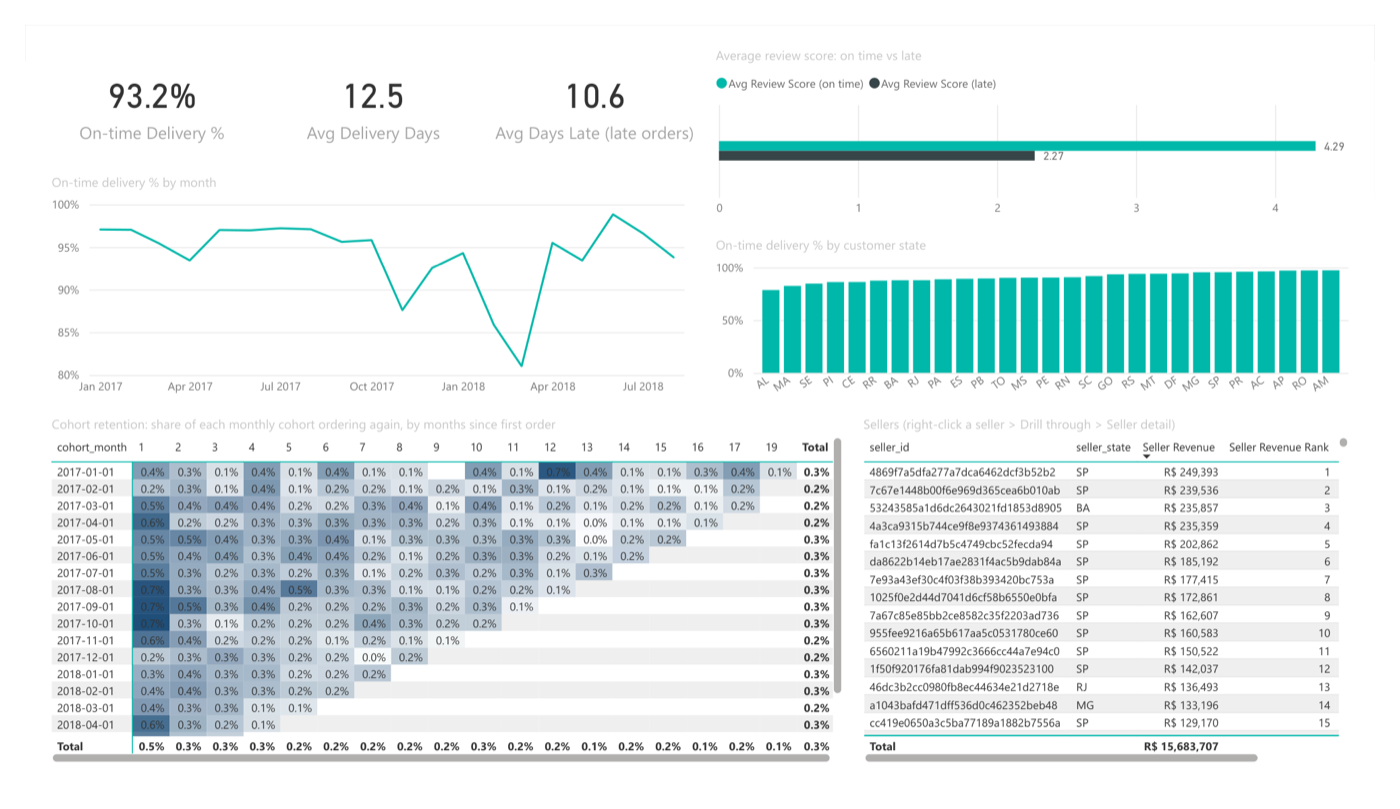
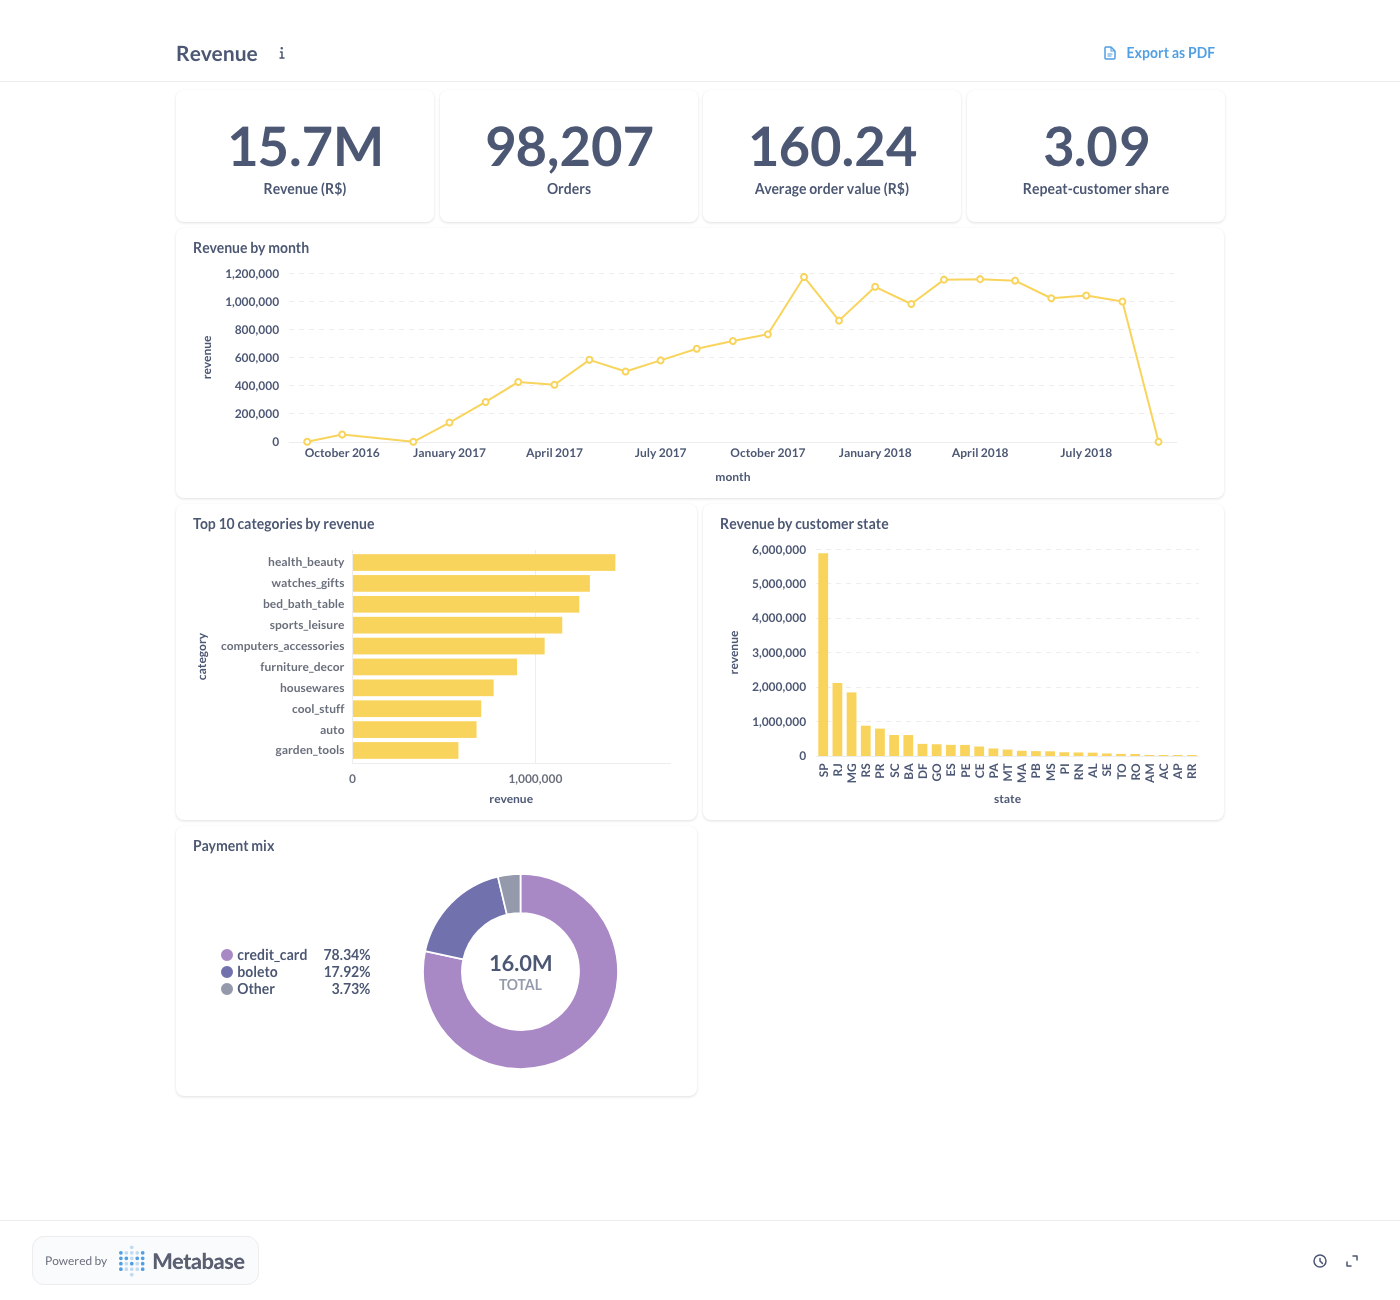
On top of the marts sit a 4-page Power BI report (37 DAX measures, seller drill-through, row-level security by seller state) and an Excel seller workbook built with Power Query, PivotTables and XLOOKUP. Both match the warehouse revenue to the cent.
How it works
Airflow runs extract → snapshot → dbt run → dbt test → reconcile. A failing test stops the run before anyone reads a bad number.
How it stays correct
An updated_at watermark with a lookback window that re-reads recent history for late commits.
MERGE applies only newer versions. A rerun with no new data applies 0 rows.
Data and watermark commit in one transaction. Tested with SIGKILL mid-load.
SCD Type 2 customer snapshots and a point-in-time join.
Measured
- Run
- The full dataset replayed in 27 ticks of 30 business days
- Every tick
- 85/85 dbt tests and 32/32 reconciliation checks passed
- Revenue
- R$ 15,843,553.24 in the source and the marts, to the cent
- Finding
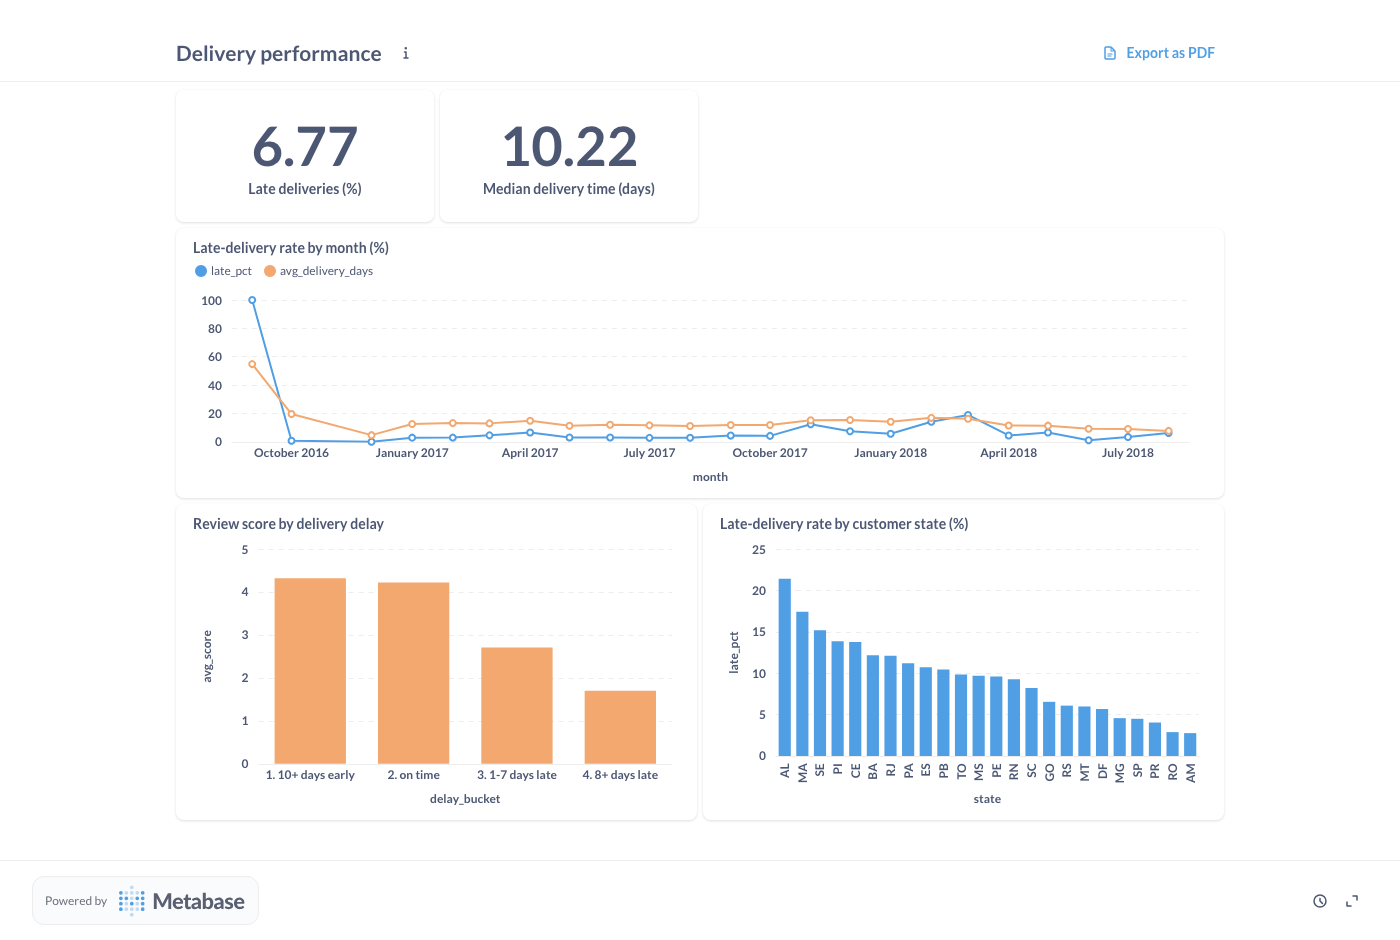
- Orders 8+ days late average a 1.7 review score, against 4.3 when on time
- BI
- Power BI report and Excel workbook agree on R$ 15,735,527.03 of non-cancelled revenue